Monitor Parameters: Monitor Type
| <Prev Resources – Windows/WMI | Index | Traffic Next> |
Monitor Type: Resources – over SNMP and SSH
| Monitor Type | Properties |
|---|---|
| Resources | |
| SNMP Custom |
OID (SNMP variable to monitor) is the object identifier of a variable to poll. It should denote a variable that will be used to calculate performance in accordance with the next two parameters, Counter Type and Divide returned value by. For counters of the Current Value type and the Delta type, non-integer variables are not supported since they cannot be interpreted as performance values. However, for the Value Change type non-integer variables are permitted. SNMP Version is the protocol version. Port is an SNMP service port, usually 161. Credentials section allows you to select an authentication method: SNMP version (v1, v2c, v3), community string for v1 and v2c, and user credentials, authentication and privacy protocol for v3. Below is a brief tutorial on SNMP monitoring. You should specify an SNMP variable to monitor by entering a numeric object identifier value for it. You can either enter it directly in the parameter editor or open the SNMP MIB browser dialog and select one of the variables supported by the host. The best way to resolve an unknown OID is to search for it on the hardware manufacturer’ site. Also, you can use our online MIBs resource to find, download and import the MIB file that describes the variables. Please note that when entering an OID value manually you should append a zero node .0 to each object identifier denoting a scalar object and a row number starting from one to each object identifier denoting a column in a tabular object. For instance, 1.3.6.1.2.1.1.3.0 is a system uptime counter and 1.3.6.1.2.1.2.2.1.16.1 is an outgoing traffic counter for the first network interface. When using the SNMP MIB browser, OID values are constructed automatically. Some SNMP counter values increase over time and their absolute values are not of interest but deltas are. For example, a counter can return the total number of bytes sent by the network interface while it is important to monitor the number of bytes sent per second. To automate this task, the Counter Type parameter can be used. Its Current Value parameter indicates that an actual counter value should be regarded as performance while its Delta parameter instructs the monitoring service to calculate deltas of each of the two subsequent performance values divided by the number of seconds between polls. Note that Delta counters do not show any value until the second poll. The next counter type, Value has changed, reports 1 if a value returned by the current poll differs from the value returned by a previous poll and 0 if they match. The state of such counters is also undefined for the first poll since it is not possible to detect changes when there is no previous value. You can define Warning State Condition of [0,0] and turn off Spike Filter for such counters; in this case, a value of 1 would cause a state transition to the Warning state and it would be possible to send alert messages on value changes by registering an alert for the Warning state. Note: the allowed value list for the Current Value parameter can be configured in the Allowed Values section (it is a list of text strings) on the monitor State conditions tab. You should format the values in the same way as they are formatted in the SNMP MIB browser. For counters of the types Value has changed and Value is allowed, their current values are written to the system log on each change and you can see them in the Logs Pane. Don’t use these counters to monitor values that change constantly, such as timers. This will generate huge logs. Such counters are basically intended to handle variables that have known and / or limited sets of allowed values and change infrequently. They are also suitable for monitoring non-integer variables. Divide returned value by parameters can be used to normalize performance values. For example, the sysUpTime counter defined by the SNMPv2-MIB that has numeric value 1.3.6.1.2.1.1.3.0 returns performance values measured in hundredths of a second. To convert such values to hours you can specify Divide returned value by parameter as 360000 (100msec * 60sec * 60min). Note on SNMP authentication: Community String is an SNMP community string; many systems use the string public as the default value. This parameter is only used by SNMP v1 and v2 monitors.
|
| SNMP Generic Trap |
Unlike most of the other monitors this one is passive, i.e. it doesn’t poll the device periodically but is called when an event takes place on the device causing it to send an SNMP Trap. To be able to use this monitor you first need to configure your SNMP device to send traps to the host running IPHost Network Monitor. See the device manual for more instructions on how to do that. By default, IPHost Network Monitor listens to the incoming traps on the 162 UDP port. The following knowledge base article explains how to configure SNMP Trap monitors. Monitor supports SNMP v1, v2c and v3 traps in accordance with SNMP version indicated in credentials used by the monitor. Note: SNMP v1 and v2c traps are not distinguished. SNMP v1 / v2c trap is caught when community string indicated in SNMP credentials matches the one reported in a trap message, even if SNMP version in credentials does not match. Note: there is an important restriction on SNMP v3 credentials that are used with SNMP Generic Trap monitor. You are not allowed to use the same User name in different SNMP v3 credentials. If you are using the same User name on different hosts, make sure that security settings (authentication and privacy methods and keys) are the same for the User on all these hosts. If you need to use different security settings on different hosts, define different User names for these hosts, as well. Due to passive nature of this monitor it differs from other monitors with respect to state changes. When monitor is (re)started, it remains in the Unknown state until first trap is received. State changes upon receiving a trap depend on SNMP Trap Type:
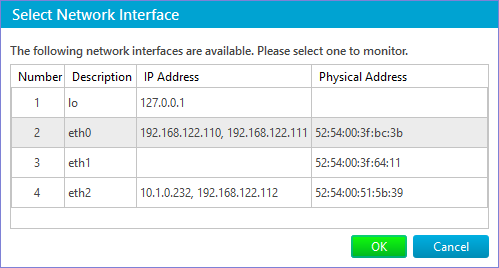
Incoming SNMP traps that do not correspond to any of the configured monitors are just ignored. In particular, traps may be filtered out using regular expressions as explained below. Once a trap is received the monitor triggers an Event so a corresponding Alert can be executed. The $EventDetails variable will contain a list of all bound variables and their values, so you can pass them to the Alert executed upon receiving the trap. Custom SNMP Trap OID – is enabled if the Custom trap option is chosen and allows specifying the SNMPv2 snmpTrapOID of an arbitrary vendor-specific trap. Any value will accept any trap, so using this option you can get all traps sent by the device. Note: for SNMPv1 traps, the OID should be constructed following the procedure described in RFC 3584, clause 3.1. In short, if the SNMPv1 generic-trap parameter is ‘enterpriseSpecific(6)’, the SNMPv2 snmpTrapOID should be a concatenation of the SNMPv1 enterprise parameter and two additional sub-identifiers, ‘0’, and the SNMPv1 specific-trap parameter. Accepted trap object identifiers and Ignored trap object identifiers – are enabled if the Custom trap, filtered by regexp type of Custom Trap is selected. Interface – is enabled if one of the linkUp/linkDown, linkDown or linkUp options is chosen and specifies the index of the network interface from which SNMP traps are expected. You can either enter it directly on the Main parameters Tab as it is specified in the IF-MIB::ifTable table or choose it in the dialog opened if you press the Select button:
Accept any v1/v2c community string – is a checkbox that allows accepting a trap with any community string. This setting is ignored when SNMP v3 credentials are selected. Payload encoding allows to determine which encoding will be applied to setting Filter trap payload with a regular expression or to Trap Payload state condition. Filter trap payload with a regular expression allows you to accept or ignore a trap according to its payload (data sent with a trap as optional variable bindings) content. A monitor will only detect a trap with payload content that suits two regular expressions that are applied to each ‘OID=value’ pair in the payload content:
Example 1: If a Trap monitor is configured to send an e-mail message as an alert, then you can see the entire trap payload in the following alert message: SNMP Trap: enterprises.31999.3.4.5 (.1.3.6.1.4.1.31999.3.4.5) at 20.05.2015 13:33:05 The following two text strings (without quotes) are constructed for filtering from this trap payload content:
Hence, to filter this trap by its payload content you need to specify regular expressions that will be applied to these two text strings. The monitor will accept a trap if no string from this list matches the “Ignored payload regexp” and at least one string from this list matches the “Accepted payload regexp”, as shown in the examples below. Example 2: If a given trap payload can contain pairs like the following (let the OIDs differ in the last group only): Example 3: If for the same trap you need to accept traps with a payload that contains the ‘1.3.6.1.4.1.31999.12.444.107=Text message1’ pair and to ignore traps with a payload that contains all ‘<any OID>=Text message2’ pairs, then you can set the “Accepted payload regexp” to ‘\.107=Text message1$’ (no quotes) and set the “Ignored payload regexp” to ‘=Text message2$’ (no quotes). If no “OID=value” string (constructed from the payload content pairs) matches the “Ignored payload regexp” (i.e. no value equals to “Text message2”) and there is a string that matches the “Accepted payload regexp” (i.e. its OID ends with “.107” and value is equal to “Text message1”), then the trap will be accepted. The trap from Example 1 will be ignored, since the second ‘OID=value’ pair value of it’s payload contains the “Text message2” string. Note: If both expressions are empty, the payload is not filtered. The SNMP Trap monitor has a specific state condition section: Event Timeout that can simplify the tracking of regular traps, such as heartbeat traps. Example 4: Let’s assume that we need to track a heartbeat SNMP Trap that is sent every 1 minute. We know, that sometimes a trap can be overdue up to 10 seconds, and we want to allow no more than 3 traps in a row delayed for no more than 10 seconds each, since we think it is a temporary glitch that does not require our immediate attention. For this case we need to create an SNMP Trap monitor, specify an OID, and add an Event Timeout state condition section on the monitor’s State conditions tab (by default, this state condition is turned off). In this new section we need to set the timeout to 60 seconds, turn the spike filter on, set the number of traps that are allowed to be overdue to 3, and set the custom interval to 10 seconds. If 3 or fewer traps in a row are detected, each within an “extended” interval (60s + 10s), then the monitor remains in the OK state. If the 4th trap is overdue or missing, the monitor switches to the Down state, and the spike counter is reset. If one of the first 3 traps is overdue for more than 10s, the monitor switches to the Down state as well, and the spike counter is reset. Example 5: If you need to test how a Trap monitor receive traps, use Net-SNMP package to test it. Install the latest binaries downloaded from the above site and use supplied snmptrap utility to emulate sending traps (the sample command below assumes you have installed the Net-SNMP package using default settings): snmptrap.exe -v 2c -c public 127.0.0.1:163 “” 1.3.6 1.1.2.5 s “Test” Note: When sending a trap from a Windows-based host be sure that your command contains double quotes to pass empty strings. For Unix-based systems it doesn’t matter which quotes either single or double will be used for this. Start monitor in OK state – is a checkbox that allows to set up if the monitor have to be started in ‘OK’ state or in ‘Unknown’ one. By default used the ‘Unknown’ state which will be switch to ‘OK’ or ‘Down’ if specified trap will be recieved or not recieved in range of a defined timeout. But if you need to switch the monitor to ‘Down’ or ‘Warning’ state only when a payload received which contains some specific pattern and keep ‘OK’ state if it doesn’t come, then use this setting to start this monitor in ‘OK’ state. |
| SNMP Disk space |
Disk name (mount point like ‘/’, no quotes, for UNIX-like machine, or disk path like ‘c:\’, no quotes, for Windows machine) – is a name of a local disk on a local or remote computer. Show disk space as parameter is the same as for WMI Disk space monitor. Port allows to specify what port to use to connect with SNMP agent, 161 by default. Credentials section allows to specify SNMP-specific credentials: community for SNMP versions v1 and v2c, and username, an authentication type, privacy protocol, password and encryption key for SNMP version v3. Note: it is possible that SNMP agent does not provide disk space data for a given filesystem. In this case you can either configure the agent to provide the data, or consider using Disk space monitor of other kind. |
| SNMP CPU |
Metric is a drop-down menu that allows to select what performance counter you want to monitor. All the counters have the same meaning as for WMI CPU monitor. Other parameters: Port and Credentials are the same as for SNMP Disk space monitor. Note: only Total active time metric is available for this monitor for a Windows host. If other metric is selected, the monitor immediately switches to Down state and writes the following error message to Logs Pane: “Poll failed: No information for this metric”. |
| SNMP Memory |
Metric is a drop-down menu that allows to select what kind of memory to monitor:
Show [Free|Used] memory drop-down menu allows to select what to measure: free or used memory. And show as parameter allows to select units: Mb or percentage of total memory of the kind. Other parameters: Port and Credentials are the same as for SNMP Disk space monitor. |
| SNMP Process |
Metric parameter is the same as for WMI Process monitor. Name is a process name, how it is shown in Windows Task Manager, or in the output of UNIX-like ‘ps’ command. For example, ‘svchost.exe’ or ‘sshd’ (no quotes). Mandatory arguments are the arguments to identify a process. For example, if you specify ‘-k netsvc’ (no quotes), then only processes with this argument will be counted. Other parameters: Port and Credentials are the same as for SNMP Disk space monitor. Note: it is possible that SNMP agent does not provide an argument list for a given process. For example, some processes arguments are not listed in corresponding table on MacOS X. In this case the monitoring system will not be able to separate processes by their arguments. |
| SSH Disk space |
Disk name (mount point like ‘/’, no quotes, for UNIX-like machine, or disk path like ‘C:’, no quotes, for Windows machine) – is a name of a local disk on a local or remote computer. Show disk space as parameter is the same as for WMI Disk space monitor. All other parameters are similar to SSH script monitor parameters: Port (integer, by default 22), is a port to connect to. Host Key Fingerprint – if this checkbox is checked, the Host Key Fingerprint is compared with the actual fingerprint used by the destination host. When they don’t match, the credentials are not sent to that host and the monitor is considered Down. You can get a current host fingerprint from the error message in the Logs pane and paste it to the Host Key Fingerprint parameter to make this check succeed. Authentication – this parameter defines an authentication method to use. Authentication By password uses the credentials selected in the Credentials section. Authentication By public key uses the values of Path to Public Key File and Path to Private Key File (these should be obtained using the ssh-keygen utility as explained here and registered on your SSH server) as well as Passphrase for a private key. The last authentication method, By public key or password, attempts to authenticate both ways, first by the public key, next by the password. Note: According to its name this monitor requires that the monitored host is accessible via SSH protocol. |
| SSH CPU |
Metric is a drop-down menu that allows to select what performance counter you want to monitor:
All other parameters (Port, Host key fingerprint and Authentication) are similar to SSH Disk space monitor parameters. Note: According to its name this monitor requires that the monitored host is accessible via SSH protocol. |
| SSH Memory |
Metric is a drop-down menu that allows to select what kind of memory to monitor:
Show [Free|Used] memory drop-down menu allows to select what to measure: free or used memory. And show as parameter allows to select units: Mb or percentage of total memory of the kind. All other parameters (Port, Host key fingerprint and Authentication) are similar to SSH Disk space monitor parameters. Note: According to its name this monitor requires that the monitored host is accessible via SSH protocol. |
| SSH Process |
Metric parameter is the same as for WMI Process monitor. Name is a process name, how it is shown in the output of UNIX-like ‘ps’ command. For example, ‘apache2’ (no quotes). Mandatory arguments are the arguments to identify a process. For example, if you specify ‘-k start’ (no quotes), then only processes started with this argument will be counted. All other parameters (Port, Host key fingerprint and Authentication) are similar to SSH Disk space monitor parameters. Note: According to its name this monitor requires that the monitored host is accessible via SSH protocol. Note: This monitor is not available for Windows host. If created, it immediately switches to Down state and writes the following error message to the Logs pane: “Poll failed: Execution failed with exit status 3: Unsupported OS”. |
| Syslog |
Like SNMP trap monitor this one is also passive and is called when an event takes place on the application or device causing it to send a message via syslog. Monitor recognises RFC 3164 and RFC 5424 syslog format. First you gonna need to configure your application to send messages to the host running IPHost Network Monitor. Refer to the application manual on how to do that. By default, IPHost Network Monitor listens to the incoming messages on the 514 UDP port. Due to passive nature of this monitor it differs from other monitors with respect to state changes. When monitor is (re)started, it remains in the Unknown state until first syslog message is received. The monitor enters the OK state and it remains this way upon receiving the subsequent messages. However you can use the Down State Response Timeout State Condition to specify the timeout to automatically switch the monitor to Down state if no new message arrived over the specified time interval. Incoming messages that do not correspond to any of the configured monitors are just ignored. They may be filtered out with the options below. Upon receiving a message the monitor triggers an Event so a corresponding Alert can be executed. The $EventDetails variable will contain a list of all recognized parameters and their values, so you can pass them to the Alert executed upon receiving the trap. Level – the 7 security levels that are included by default. You can (de-)select any of them. Facility – the 23 facility levels that are included by default. You can (de-)select any of them. Application name (tag) – the name of a sender whether it is application or device. Can be partial. Ignored if empty. Process ID – the PROCID field of the RFC 5424. The process ID of the sender application in the message. Ignored if set to -1. Message ID – the MSGID field of the RFC 5424 Structured data filter for the STRUCTURED-DATA field of the RFC 5424 works the following way:
Filter log message with a regular expression allows you to accept or ignore a message according to its contents. A monitor will only detect a message that suits two regular expressions:
|
| <Prev Resources – Windows/WMI | Index | Traffic Next> |