Reporting
IPHost Network Monitor provides various group and detailed reports and graphs, as well as logs. The reports contain information necessary to trace resource utilization trends and to plan upgrades; besides, reports and logs provide the possibility to trace the results over a certain time period. Also, the reports can be used as an accounting basis for the administrators’ work results.
There are two ways to access monitoring reports in IPHost Network Monitor:
- Via a Windows Interface.
The Windows UI (monitoring client) allows you to access detailed reports for monitors and summary reports for groups and categories. A reporting period can be any number of days and hours until now. The default report period is 24 hours (one day) until the present point in time. To adjust the report period for the Windows UI select the Tools > Settings menu or click the Settings button on the toolbar, then select the Reporting tab and set the required number of days and hours.
- Via a Web Interface
Apart from the Windows client UI, IPHost Network Monitor also has a Web interface that has the Report Tab allowing access to additional types/forms of reports for any period of time. The Report Tab provides you with online access to all reports and graphs for any time period. There are three panels: the contents of the left panel completely duplicates the panel Tree View, the upper panel serves to select the type of report and time period, the remaining space is reserved to display a report itself. Similar to what is implemented in the Windows interface, in the Web interface when pressing on a report reference the appropriate report is loaded and in the left panel the focus is shifted to an element corresponding to it.
Report Types
There are five types of reports in IPHost Network Monitor:
- A summary report for a group, host, monitor type or the entire system.
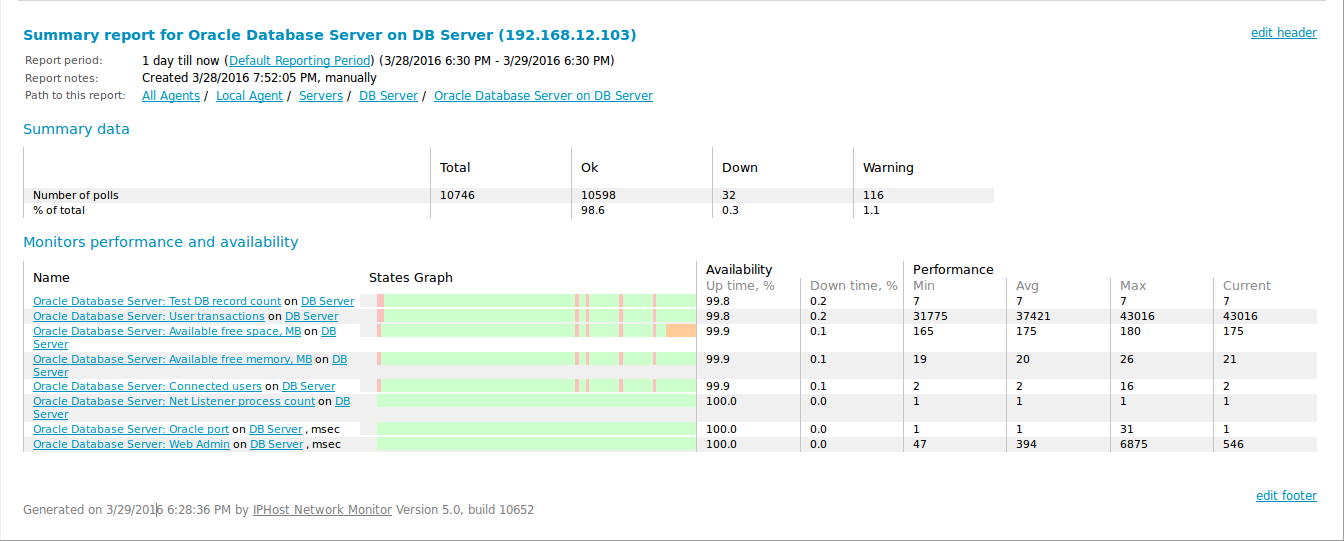
The report provides summary data on the availability and performance of all the monitors of a selected group, host, monitor type or the whole system. The pseudograph shows approximate time intervals when the monitor was in problem states.
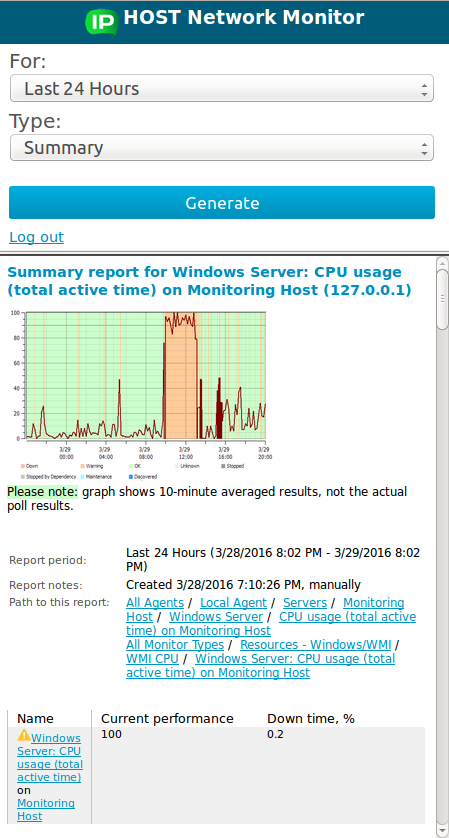
- A summary report for a monitor.
Although it has the same name it significantly differs in contents. The report presents detailed and nearly full information on the monitor’s availability and performance over a period of time.
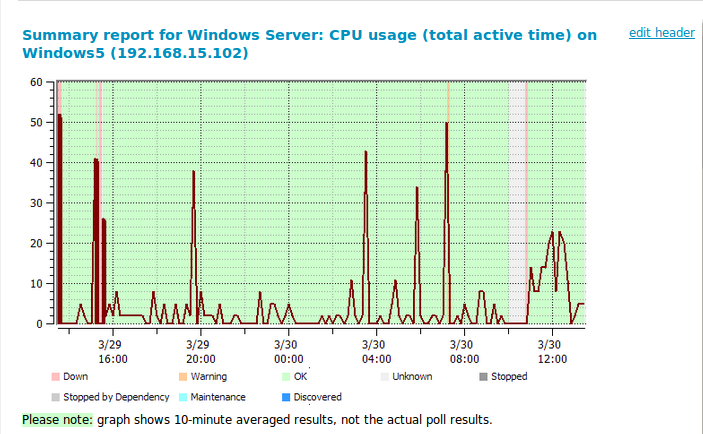
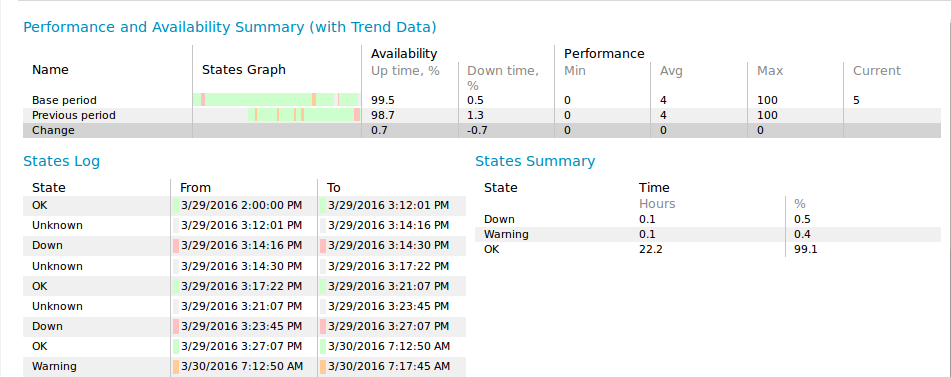
It contains a performance graph, summary data on the monitor’s availability and performance (for a selected period and a previous period of the same duration), a states log (showing the state of the monitor during a selected period) and states summary information (showing for how many hours the monitor was in problem states and their percentage).
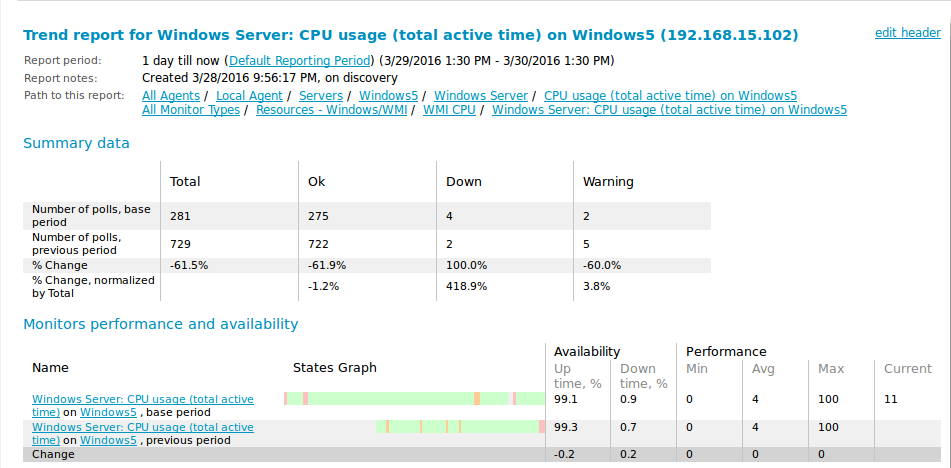
- A trend report.
The report presents comparative data on the availability and performance of monitors. For each monitor you can see summary data for a selected period, for a previous period of the same duration and the difference between them. You can use this report for identification of short or long-term trends in the monitors’ performance and availability.
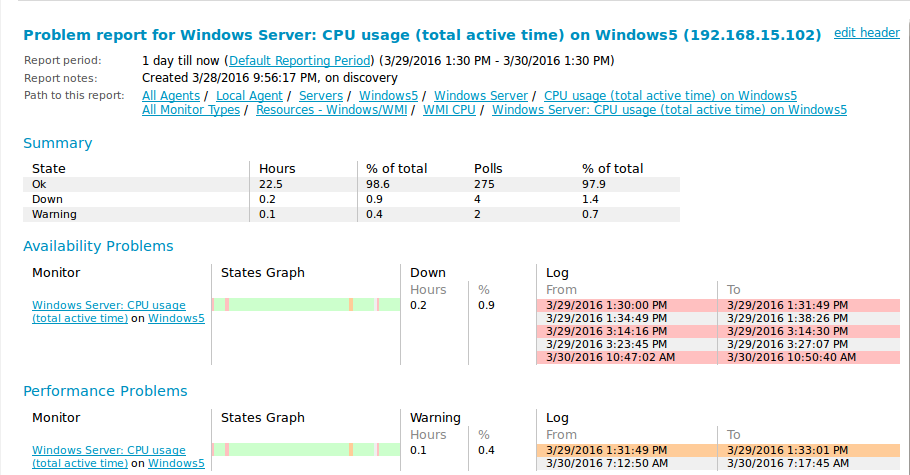
- A problem report
This report shows summary information on availability and performance problems that occurred during a period.
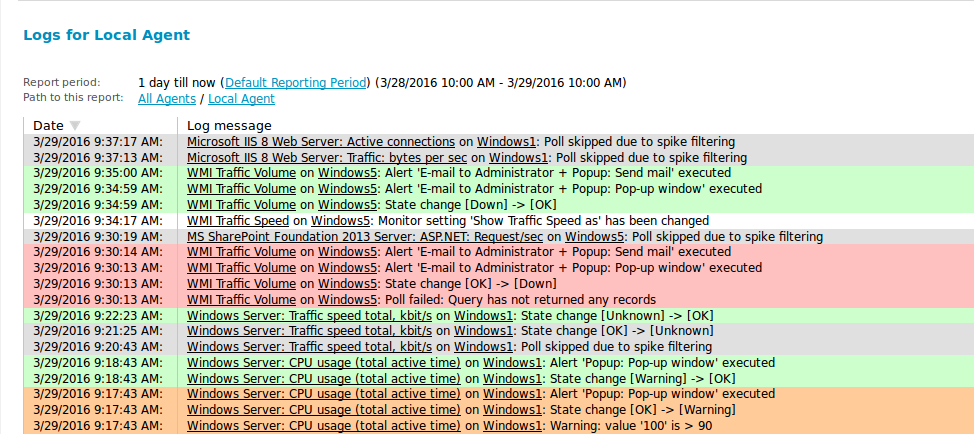
- Logs
This report shows log messages for the selected monitor or group and/or system log messages over a period of time on a common timeline. You can select types of messages to show and log direction on the Parameters panel for this report.
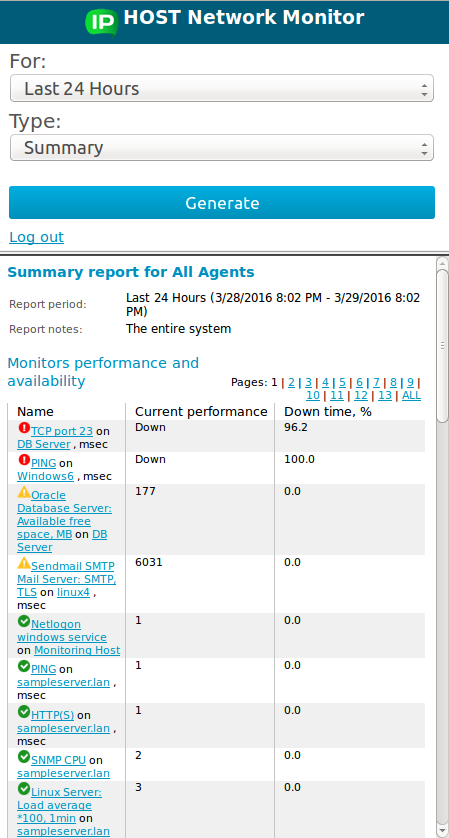
A Web Interface for Mobile Devices
There is a special version of the Web interface for mobile devices (PDA, smartphones and handheld devices). Reports generated by this version are optimized for small screen resolution. Besides, they are shorter since mobile devices often use slow Internet connection. You can access a mobile version of the Web interface by navigating or bookmarking a URL as shown below http://yourhost.yourdomain:8084/nms_mobile.
Mobile versions of summary reports for a group and for a monitor are shown below.
 |
 |
The other reports remain unchanged in the mobile version of the Web interface.
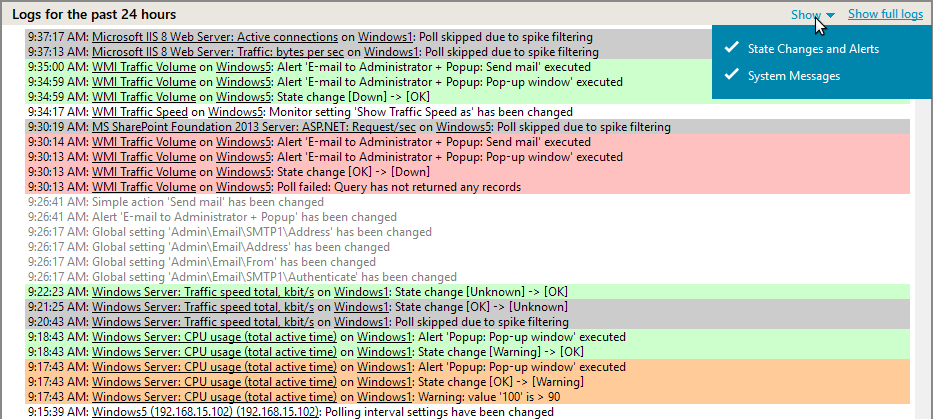
The Logs Pane
The Logs Pane in the client application shows two kinds of log messages:
- System messages (not monitor specific, shown in gray font);
- State changes and alerts for selected monitors (the line is highlighted in the color corresponding to a state).
The messages in a log are ordered chronologically. If you click a link in the Log pane, the entity will be selected in the Tree view and Parameters/Results pane will be switched to this entity.
Receiving Scheduled Reports by E-mail
The IPHost Network Monitor automatically generates status reports for the last day/week/month over the entire system. By default, IPHost Network Monitor sends a summary report for the last day to the admin e-mail. You can select additional mailing lists or specify additional addressees by selecting the menu Tools > Settings (or by pressing the button Settings on the toolbar) and further selecting the tab Reporting in the open window.

You can also set up regular reporting for any group node or any single monitor, using the Regular Reporting section in the corresponding Main parameters Tab section.