Settings Dialog
| <Prev DB Maintenance | Index | Alerts Next> |
Monitoring
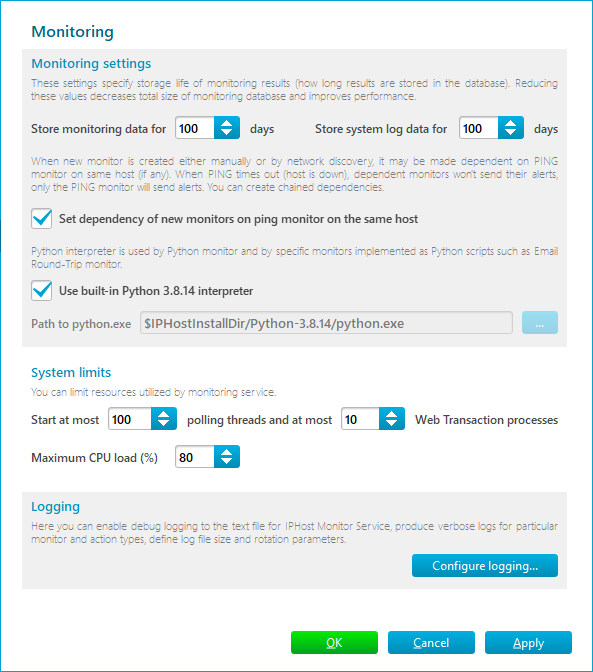
This page contains various monitoring options. It allows you to fine-tune the monitoring process.
The Monitoring settings section contains the following settings:
-
The number of days to store monitoring data and log messages in the database. The default value is 100 days for both settings. You can decrease this number if you don’t need to analyze data over one month old and want to prevent the database from growing huge.
-
An indication whether newly created monitors should be set to depend on a PING monitor on the same host, if any. This dependency type allows avoiding extra alarms if a given host stops; the alerts for its PING monitor will only be executed, and the other monitors will silently enter the Stopped by Dependency state.
-
An indication whether to use a built-in Python interpreter or a different one (in which case path to python.exe has to be specified). Python interpreter is used to execute custom scripts specified in Python monitors and actions as well as to execute specific built-in Python scripts, for example, those used by the Email Round-Trip monitor.
The System limits section contains a maximum thread count in a thread pool, maximum Web Transaction Monitor process count, and maximum CPU load thresholds. If any limit is exceeded, starting new tasks such as polling a monitor, performing a web transaction, or sending a report is delayed. The default values of these settings are sufficient in most cases.
The Configure logging… button in Logging section opens a logging configuration dialog. The dialog allows to enable debug logging for a particular monitor types (like ‘HTTP(S)’ or ‘Windows Service’) or action types (like ‘Send mail’ or ‘SMS over e-mail’). The main objective of the debug logging is to provide our Technical Support with additional data in case something went wrong in your monitoring system. There is no need to enable debug logging if everything is fine.
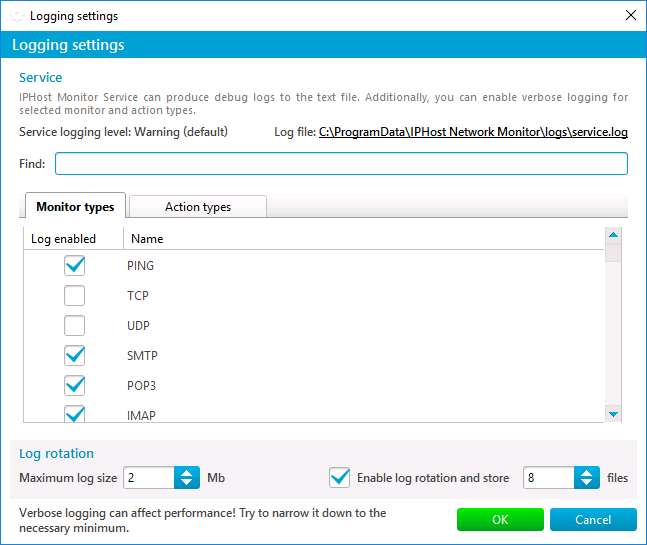
The monitoring service outputs its logs into %ProgramData%\IPHost Network Monitor\data\service.log file. By default only two log files (the current one and the previous one) are stored: service.log and service.bak. You can specify the log file size. In order to store all the debug info, you can enable log rotation and set the number of log files to store. A stored log file will be archived and renamed using its end-time timestamp, like service_2017-11-08_10-11-12.log.zip.
You can click on the log file link to open it in a text editor. This is the service log file sample in the following format [date|time|internal id|host|monitor type|monitor id|operation]:
2017-11-08 13:20:55.794: [1870] 192.168.11.102: SMTP monitor, id=133: check settings
2017-11-08 13:20:55.794: [1870] 192.168.11.102: SMTP monitor, id=133: check port
2017-11-08 13:20:55.794: [1870] 192.168.11.102: SMTP monitor, id=133: port check ok
2017-11-08 13:20:55.794: [1870] 192.168.11.102: SMTP monitor, id=133: check settings ok
2017-11-08 13:20:55.795: [1870] 192.168.11.102: SMTP monitor, id=133: resolve address
2017-11-08 13:20:55.795: [1870] 192.168.11.102: SMTP monitor, id=133: resolve address ok: ‘192.168.11.102’
2017-11-08 13:20:55.795: [1870] 192.168.11.102: SMTP monitor, id=133: initialize client
2017-11-08 13:20:55.795: [1870] 192.168.11.102: SMTP monitor, id=133: initialize client ok
2017-11-08 13:20:55.795: [1870] 192.168.11.102: SMTP monitor, id=133: set credentials
2017-11-08 13:20:55.825: [1870] 192.168.11.102: SMTP monitor, id=133: set credentials ok
2017-11-08 13:20:55.825: [1870] 192.168.11.102: SMTP monitor, id=133: connect to ‘sampleserver.lan’ as ‘tester.iphm’
2017-11-08 13:20:57.795: [1674] 192.168.13.103: PING monitor, id=83: dns resolution
2017-11-08 13:20:57.795: [1674] 192.168.13.103: PING monitor, id=83: resolve address
2017-11-08 13:20:57.795: [1674] 192.168.13.103: PING monitor, id=83: resolve address ok: ‘192.168.13.103’
2017-11-08 13:20:57.795: [1674] 192.168.13.103: PING monitor, id=83: opening raw socket
2017-11-08 13:20:57.796: [1674] 192.168.13.103: PING monitor, id=83: sending request #1
2017-11-08 13:20:57.796: [1674] 192.168.13.103: PING monitor, id=83: sending request with id=1730 time=1012119609 tics
2017-11-08 13:20:57.796: [1674] 192.168.13.103: PING monitor, id=83: waiting for reply
2017-11-08 13:20:57.797: [1674] 192.168.13.103: PING monitor, id=83: receiving reply
2017-11-08 13:20:57.798: [1674] 192.168.13.103: PING monitor, id=83: closing socket
2017-11-08 13:20:57.798: [1674] 192.168.13.103: PING monitor, id=83: socket closed
2017-11-08 13:20:57.798: [1674] 192.168.13.103: PING monitor, id=83: got reply in 1 msec
Note: enabled logging can affect monitoring service performance, hence use this feature with caution: enable logging for those entities that require special attention only. Do not forget to disable logging after the problem is resolved.
| <Prev DB Maintenance | Index | Alerts Next> |