In the short tutorial below, we will set up a SNMP monitor to gather TCP connections data. We could use those to keep statistics on TCP activity and/or control TCP connections as well. Click on the pictures provided below to see their full version.
Introduction
| IPHost Network Monitor allows you to work with all the SNMP versions (see in the monitor properties editor section). | 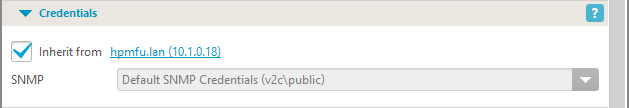 |
| IPHost Network Monitor provides tools to monitor either exact value, or the case when the value has changed. It can also check whether the value is valid. | 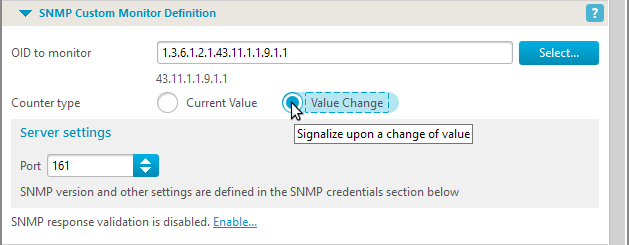 |
| There’s a convenient MIB browser tool. It allows to navigate the entire collected OIDs tree, filter required values and get the corresponding description for elements. It can be started from either “Tools” menu item… |  |
| …or by clicking [Select…] button to the right of OID value on the monitor Main parameters tab. | 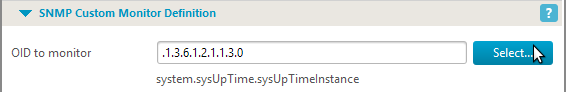 |
MIB browser can
|
 |
Starting SNMP services on the host
| Detailed explanation how to set up, configure and start SNMP services on the host machine we are about to monitor processor load on is outside the scope of this tutorial.
You should look for documentation on software packages such as net-snmp and/or firewall settings to have SNMP services be set up correctly and securely. Further on this tutorial we assume you have set up the SNMP services and the computer where IPHost Netwrk Monitor runs is allowed to connect to those services. |
Creating SNMP monitor
| We begin with creating a SNMP monitor. Let’s add a new host for a computer (or other network device — choose “New Host” from “File” menu item, or right-click on an appropriate hosts group and select “New Host”). | 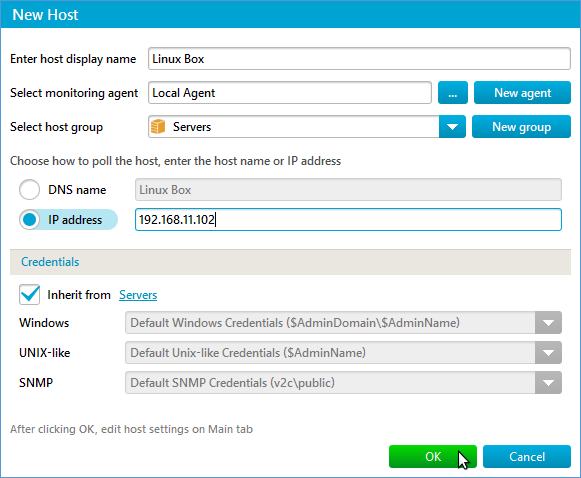 |
| After the new host has been created, right-click on it and select “New Monitor”. | 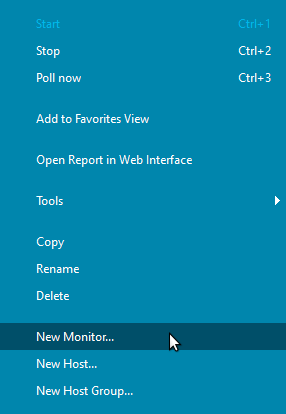 |
| Select “SNMP Custom” monitor type and click “Next”. | 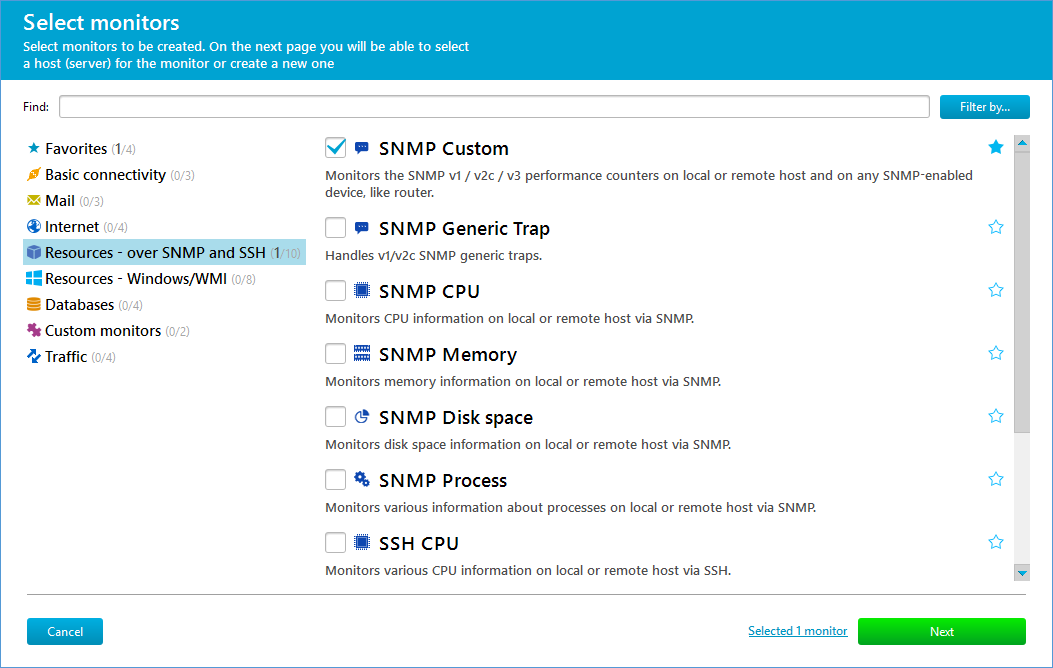 |
| On the next screen, specify the host name of the device you’re creating SNMP monitor for. If you are absolutely sure you have all the data at hand, you can also check the “Start the monitor” in the lower left corner, to activate the monitor immediately after its creation. Click “Next”. | 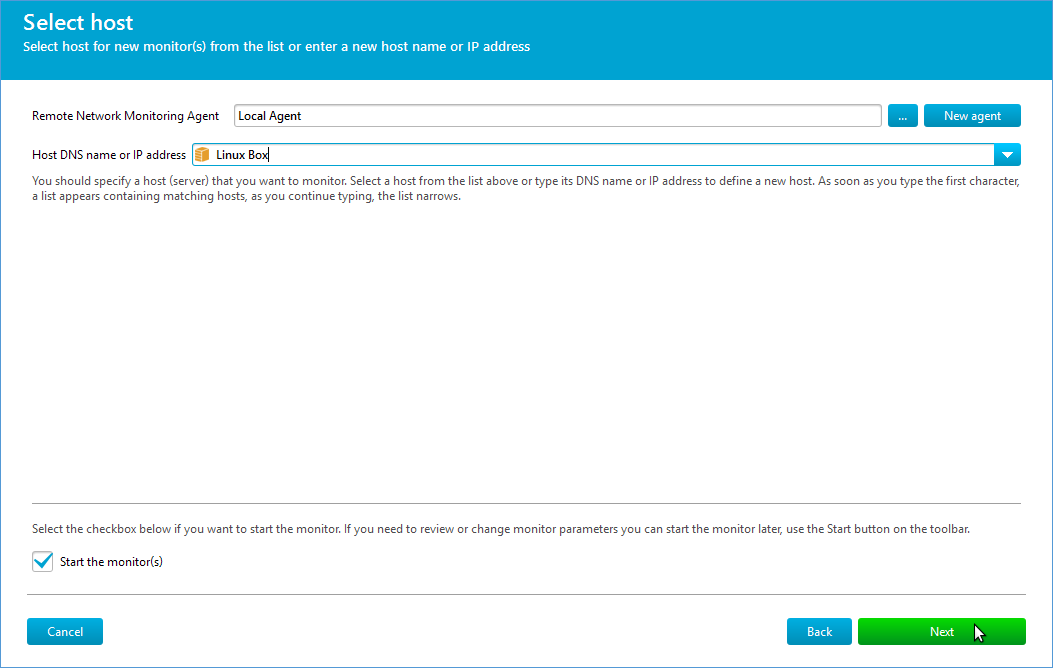 |
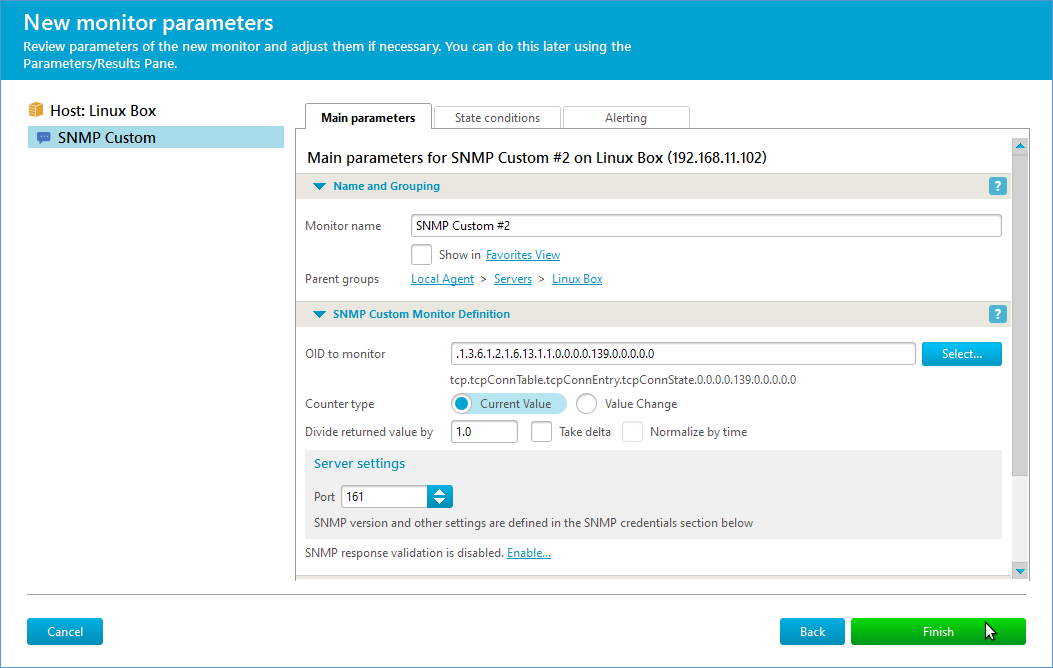
| On this final screen you can select OID to monitor, upload required MIB(s), set up threshold values to raise alerts and specify all the other parameters for the monitor. The details of setting those up are explained in the section below.
Note that while the new monitor creation wizard is running, you can’t otherwise use IPHost Network Monitor. Click “Finish” after you have completed (or if you choose to set up monitor in the “Property Editor” pane). |
 |
Setting up monitoring parameters
| Launch the MIB browser (see above how to do that) to proceed. If you haven’t loaded proper MIB file (RFC1213-MIB should do), the browser will not show you much useful information. Download the mentioned MIB file, click on “MIBs” button (lower left corner of the MIB browser) and look whether the required MIB is loaded already. | 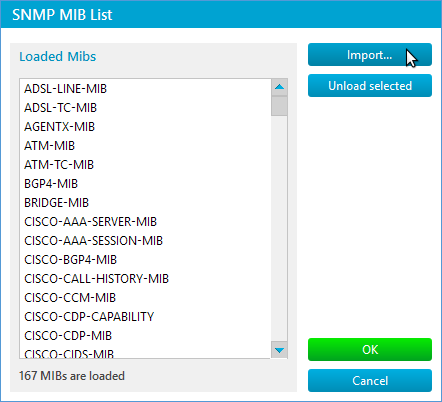 |
| If RFC1213-MIB is already on the list, skip this step safely. Otherwise, make sure the downloaded MIB file is placed into %ProgramData%\IPHost Network Monitor\mibs and click “Import” button. Select the required MIB file and click “Open”. | 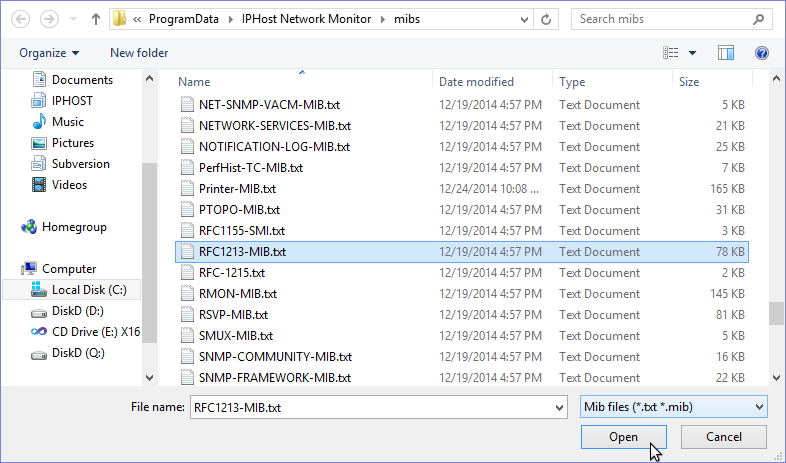 |
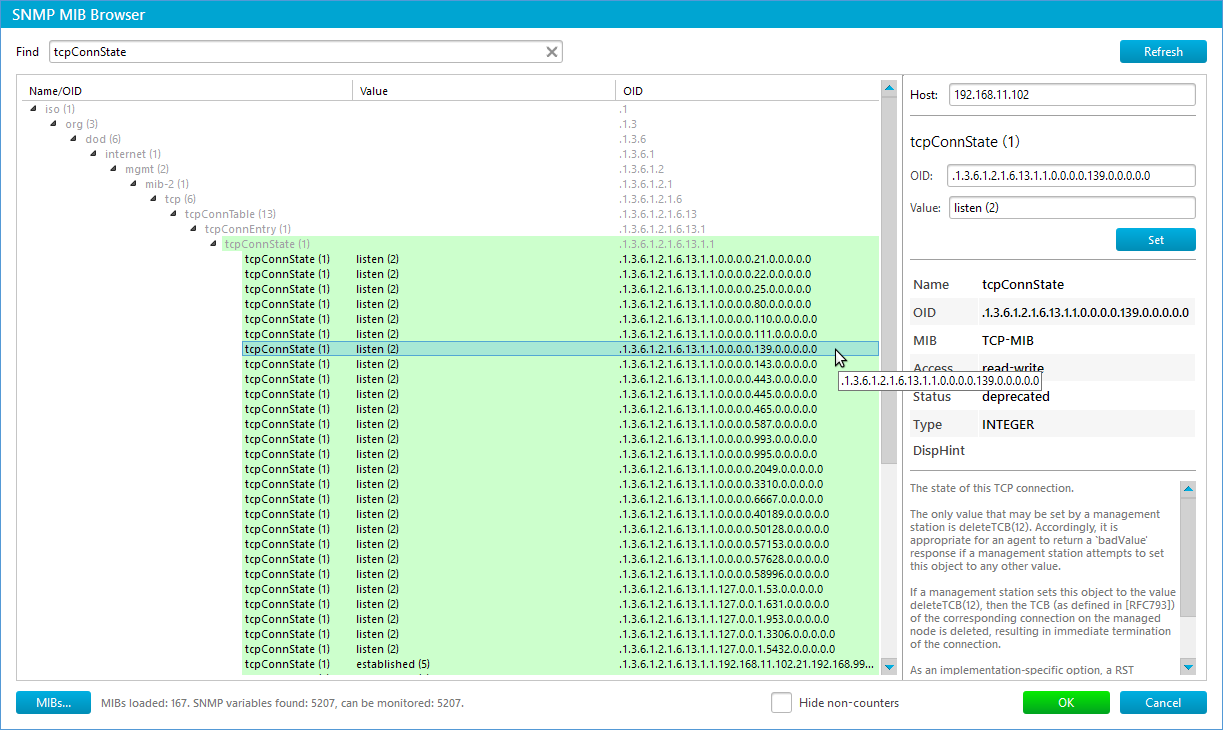
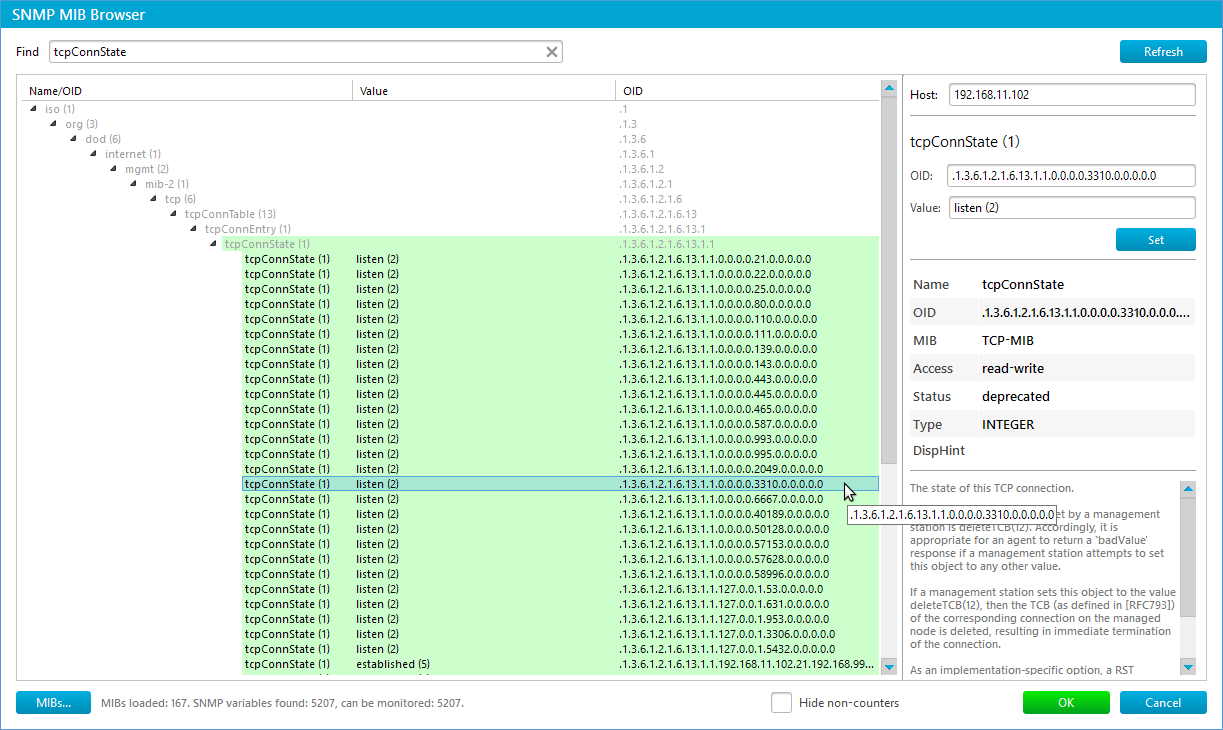
| Now refresh MIB browser window by clicking “Refresh” button. To find OIDs related to TCP connections state, type word “tcpConnState” to the right of “Find” label. The browser will only show those entries with the entered word found in elements names.
Note: the TCP connections individual entries are encoded in this manner: the branch OID identifier is concatenated with destination IP address, port, followed by source IP address and source port. Thus, we can monitor individual connections (check for their presence). In this tutorial we will monitor SMTP local services, thus the OID tail will look like 0.0.0.0.25.0.0.0.0.0. For more complex monitoring, such as listing of all active TCP connection to the given port, you could choose making a custom script calculating such values and using another type of monitor to watch the corresponding value. You can also add custom SNMP entries (refer to SNMP server documentation for details) and continue using SNMP monitor to watch the resulting value. Choose whatever way is optimal for you. Select the mentioned entry and click “OK” to return to monitor properties editor. |
 |
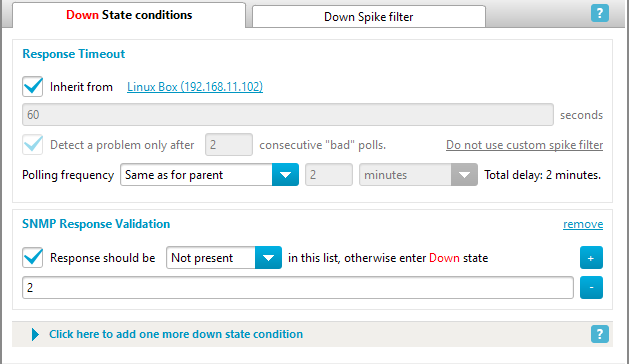
| Now we will create a monitor so that it raised an alarm wherever the watched item isn’t in ‘listen’ state.
Scroll down the properties editor until you reach “Performance Monitoring” section. Note there are two levels of alarm available. Warning, when the monitored parameter isn’t acceptable, but the situation isn’t critical, and Down when it requires instant attention. Please use your specific situation into account when setting the thresholds. In our sample, we use value of 2 to trigger a severe problem. To learn further how to set up alerts, read Alerting and Actions section of our quick start guide. |
 |
What to do next?
| It’s done! You have just made your first SNMP monitor to help you with watching whether SMTP process is alive. What now? | |
| For example, modify the polling interval on monitor Main parameters tab to appropriate values. Most probably you won’t use the default value of 60 seconds (poll every minute) and could raise it, say, to 5 minutes. | 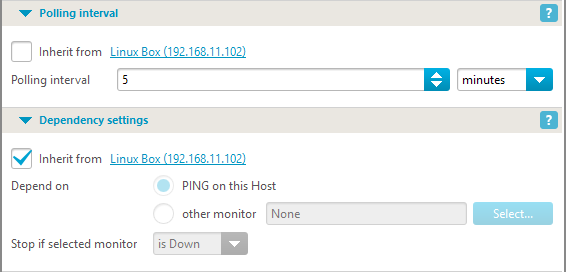 |
| You can change your newly created monitor. You can add more monitors, for other services; you can also create a script that would start/stop the corresponding connection by setting it to required value. | |
| Please consult the quick start guide for more suggestions and ideas on how to use SNMP monitors. | |
IPHost Network Monitor 5.4 build 14538 of April 21, 2023. File size: 111MB

Comments are closed.