Logs Pane

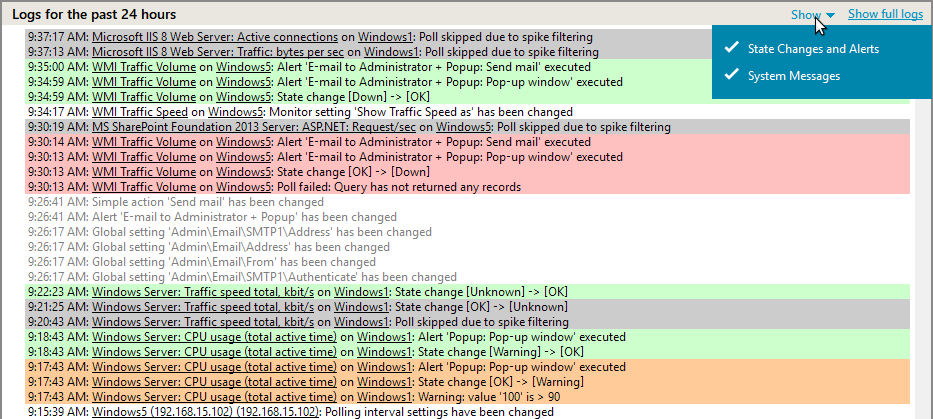
The Logs Pane displays system log messages and/or log messages for the selected item in the Tree View for the past 24 hours. When total count of matching messages exceeds 1000, only the last 1000 messages are shown. Full logs are available in the Web interface’s Report Tab.
There are two types of log messages:
- system messages and monitor configuration changes
- monitor state changes
You can select what log messages should be shown using the drop-down menu on the Logs Pane toolbar. Both log message types use the same Logs Pane with a common timeline for convenience. Log messages are color-coded as shown in the table below:
| System Messages and Warnings |
|
||||
| Monitor or Group Messages | Black font
|
All system messages are shown regardless of a currently selected item type (monitor, host or group) in the Tree View. The state change and alert log shows messages about a selected item only. A message from this log includes a hyperlink; by clicking on it you can select a corresponding object in the Tree View pane.
The toolbar in the Logs Pane has the following controls
- Show drop-down menu allows you to turn on/off either system messages or state changes and alerts messages.
- Show full log links to the Web interface’s Report Tab.

The Logs Pane context menu appears on a right-click in the log area. The menu contains the standard Select All and Copy items, and the Autoscroll item labeled with a check mark. When this item is marked, the window is automatically scrolled to show new log records. If it is not marked then the window position doesn’t change after new log records are added. Disable Autoscroll if you examine records in the middle of the log and do not want the window to change focus.


