Monitor Parameters
| <Prev Custom Monitors | Index |
Monitor Type: Virtual Machines
Note: monitors defined on this page are used in corresponding application templates. It is recommended to create instances of such templates to monitor VM hosts and guests. For example, there is a Hyper-V Hypervisor template that defines several Hyper-V Host monitors allowing to check all aspects of a Hyper-V hypervisor host.
There are also application templates allowing to monitor Xen Server host, virtual machines, and storage repositories. They are implemented as Python scripts invoked over SSH on Xen Server host rather than specific monitors. Therefore they are not documented here. Each Xen template wraps corresponding script by creating several monitors with different arguments.
Similarly, there are KVM Hypervisor and KVM Guest Machine templates implemented as shell scripts invoked over SSH. All such scripts may be found under the ‘scripts’ subdirectory of IPHost Monitor installation directory.
| Monitor Type | Properties |
|---|---|
| Virtual Machines | |
| Hyper-V Host Monitor |
Metric – allows to select what performance counter to measure:
Authentication – has the same meaning as the similar WMI Monitor parameter. |
| Hyper-V Virtual Machine Monitor |
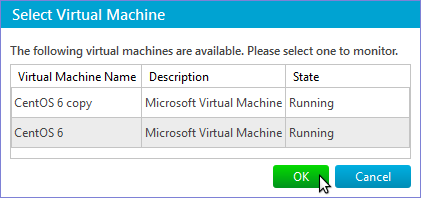
Virtual Machine Name – specifies the name of a virtual machine to monitor. The name of a virtual machine is the same as the name specified in Hyper-V Manager. The name can be set either directly or via Select Virtual Machine dialog that opens if the Select button is pressed: Note: If you change the name of a virtual machine in Hyper-V Manager you won’t have to change the value of this parameter. But in case you want to change it you’ll have to do this by clicking the Select button so that IPHost Network Monitor can reload information about virtual machines. Metric – allows to select what performance counter to measure:
Authentication – has the same meaning as the identical WMI Monitor parameter. |
| Hyper-V Virtual Storage Monitor |
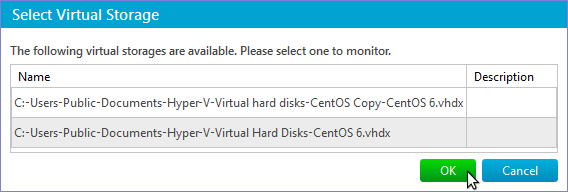
Virtual Storage Name – specifies the name of a virtual storage to monitor. Similar to Virtual Machine Name parameter of Hyper-V Virtual Machine Monitor you can set it directly or by using Select Virtual Storage dialog that opens if the Select button is pressed: Measure – specifies the counter to monitor:
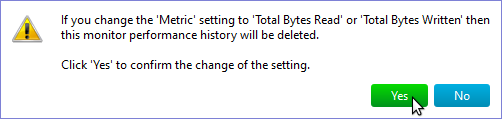
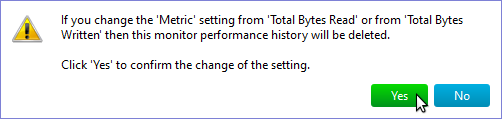
If you set Measure parameter to Total Bytes Read or Total Bytes Written a confirmation dialog will appear, since in this case performance history must be deleted: When this parameter is set to Total Bytes Read or Total Bytes Written and you change the parameter a confirmation dialog will also appear Note: The performance history will be deleted when you click Save button. So if you clicked Yes in confirmation dialog you still can prevent deleting of performance history either by manually restoring the value of the parameter or by clicking the Cancel button. If Measure parameter is set to Total Read or Total Written then you can specify units of measurement and the time period to store the data about read and write operations. For measurement units you can choose from kilobytes, megabytes, and gigabytes. The time period can be specified the same way as for WMI Traffic Volume Monitor. Authentication – has the same meaning as the identical WMI Monitor parameter. |
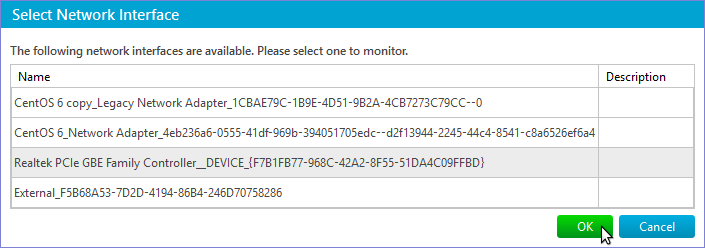
| Hyper-V Network Traffic Monitor | Interface Name – specifies the name of a virtual network interface to monitor. You can set it directly or via Select Network Interface dialog. To open the dialog click on the Select button:
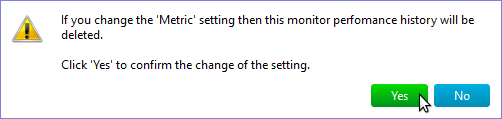
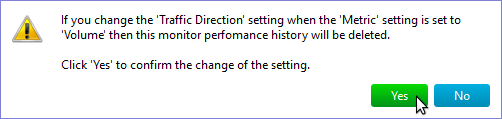
Measure – specifies the direction of traffic to monitor and what value to monitor. For direction of traffic you can choose from Total Traffic (by default), Inbound Traffic, and Outbound Traffic. As a value to monitor you can set either Speed or Volume. If you change this parameter a confirmation dialog will appear, since changing the parameter will cause deleting of the performance history: Also if this parameter is set to show volume then changing the traffic direction will also cause a confirmation dialog to appear Note: The performance history will be deleted when you click Save button. So the same way as with Hyper-V Virtual Storage Monitor if you clicked Yes in confirmation dialog you still can prevent deleting of performance history either by manually restoring the value of the parameter or by clicking the Cancel button. The and show it as parameter allows you to set the units of measurement. You can choose from Kbits/sec and Mbits/sec for Speed and from kilobytes, megabytes, and gigabytes for Volume. If monitor parameters is set to show traffic volume then you can specify the time period to store traffic data. It can be done the same way as for WMI Traffic Volume Monitor. Authentication – has the same meaning as the identical WMI Monitor parameter. |
| VMware Host Monitor |
Metric – allows to select what performance counter to measure:
Authentication – this monitor uses the Unix-like credentials selected in the Credentials section to access the VMware ESXi. |
| VMware Virtual Machine Monitor |
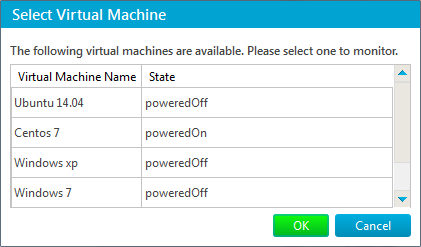
Virtual Machine Name – specifies the name of a virtual machine to monitor. The name can be set either directly or via Select Virtual Machine dialog that opens if the Select button is pressed: Metric – allows to select what performance counter to measure:
Authentication – this monitor uses the Unix-like credentials selected in the Credentials section to access the VMware ESXi. |
| VMware Datastore Monitor |
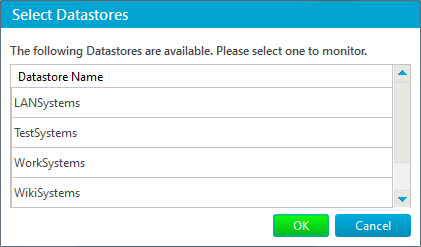
Datastore Name – specifies the name of a Datastore to monitor. The name can be set either directly or via Select Datastore dialog that opens if the Select button is pressed: Metric – allows to select what performance counter to measure:
Authentication – this monitor uses the Unix-like credentials selected in the Credentials section to access the VMware ESXi. |
| <Prev Custom Monitors | Index |