Web Interface Overview
IPHost Network Monitor provides a Web interface that allows you to access monitoring reports and a system summary. The Web Interface contains four tabs:
- Dashboard – shows your system summary status
- Reports – provides access to various types of monitoring reports
- Alerts – displays recent availability and performance problem notifications
- Current Problems – displays current availability and performance problems
The general layout of the Web interface main window is the same for all tabs. The Tree panel is on the left side of the window. It is separated from the Parameters panel and Contents panel by a vertical splitter which you can drag to resize the panels. The Parameters panel located at the top of the window is separated from the Contents panel by a grey non-movable horizontal line.
The different tabs load different content types to the panels as described below.
There is a special version of the Web interface for mobile devices. It is optimized for small screen resolution and slow connections; however, it provides reporting functionality, only without detailed reports. You can access the Web interface mobile version by navigating or bookmarking a URL that ends with nms_mobile, for instance http://yourhost.yourdomain:8084/nms_mobile.
Note: You can configure the Web interface to work via a secure channel (HTTPS).
Note: The Web interface can play sound alerts. To play an alert, on Settings – > Alerts page check the ‘Play Sound in Web browser‘ checkbox for the selected ‘Sound Alert‘, then add this alert to the appropriate alerting rule and assign this alerting rule to a monitor. When this monitor undergoes state transitions and your alerting rule is set to play a sound in the Web browser for these state changes, the Web interface will play it, if any of the Dashboard, Report, or Alerts Tabs is open. You should have Adobe Flash Player enabled in order to play sound alerts, besides, Apache Web Server that provides the Web interface should not use ports below 1024 reserved for other standard TCP based protocols (these ports are blocked in Adobe Flash Player). By default, the Web server uses permitted port 8084.
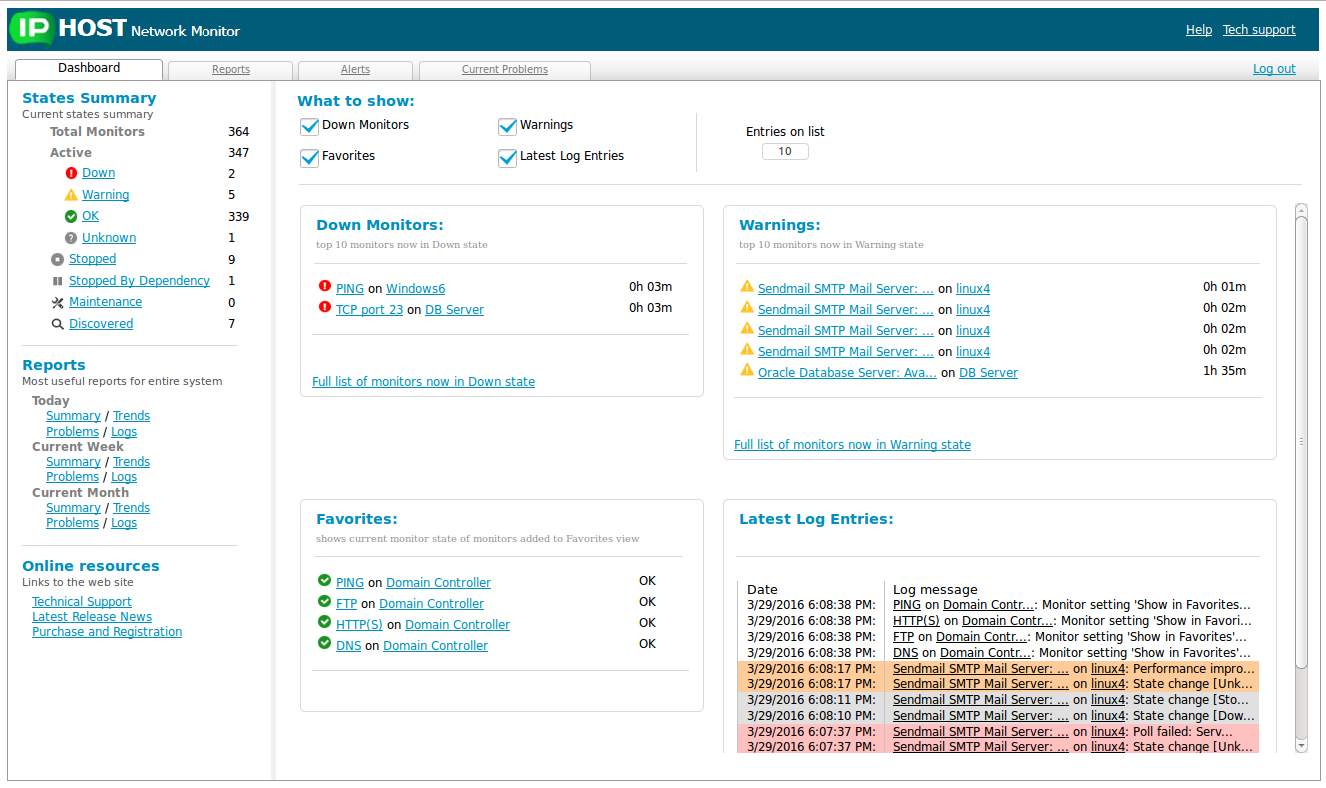
This tab shows your system status overview. The Tree panel contains a current status summary for all monitors, links to useful reports, and links to online resources. The Parameters panel allows you to choose what types of information to show in the Contents panel. The following four blocks can be shown here:
- Down monitors – monitors that are currently in Down state
- Warnings – monitors that are currently in Warning state
- Favorites – all monitors from the Favorites view
- Latest Log Entries – the most recent log records
You can also specify how many records to show in these blocks using the setting in the Parameters panel (this setting doesn’t affect Favorites; all of them are shown regardless of it).
Reports
The Reports tab provides several statistic data views and allows you to:
- quickly overlook current and previous states of your network resources
- get a list of problems for a given time period
- study trends and detect performance degradation in real-time
- obtain detailed reports that include a useful performance graph and a detailed log of state changes
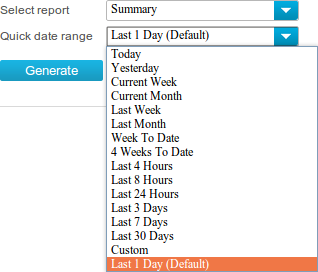
You can choose different monitor groups to generate a report; you can also choose any timeframe as well as one of the several predefined time intervals such as Today or Last week.
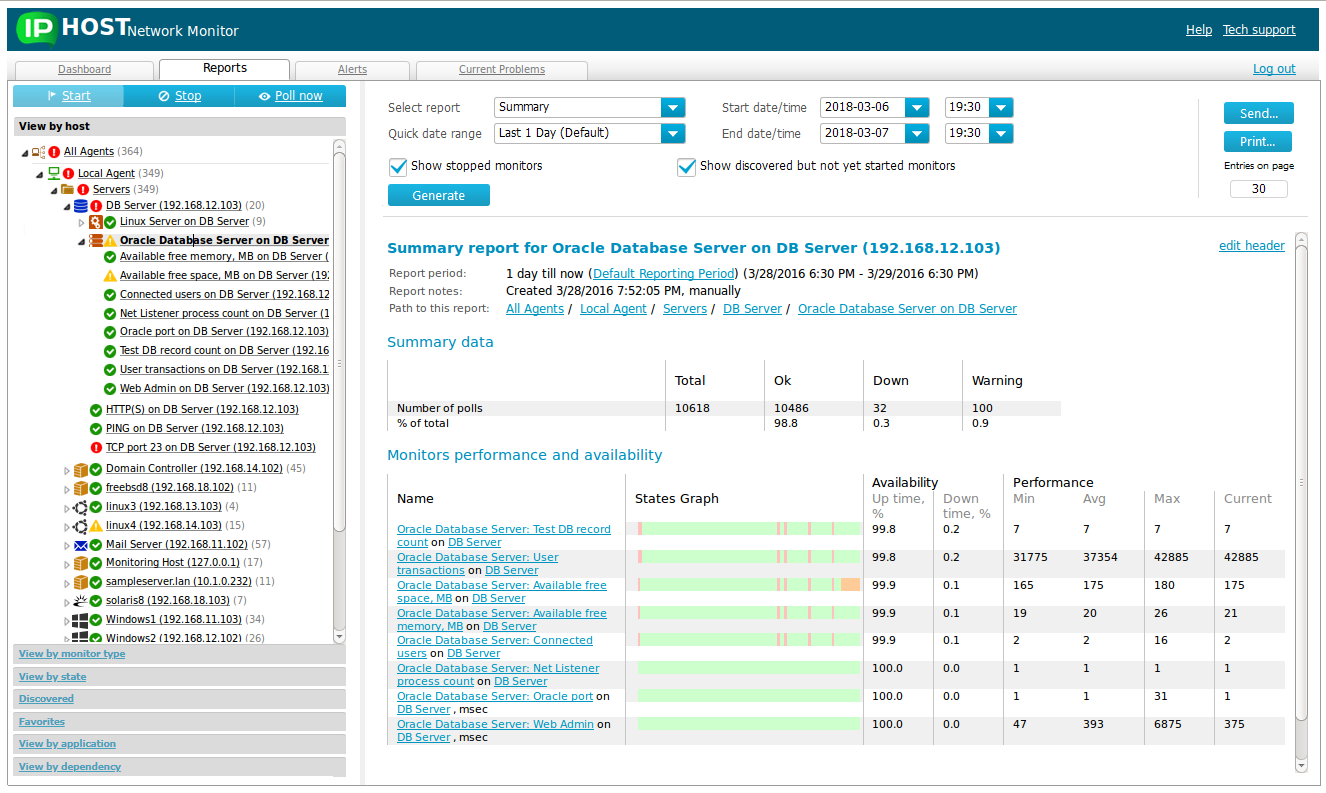
The Tree contents match the client application’s Tree View contents described in the Tree View Pane section. There is accordion control to select a view (you can select the View by host, View by monitor type, View by state, Discovered or Favorites tree). Once the selected tree is loaded, you can navigate through it and highlight the necessary monitor or resource group; your selection is marked in bold type. A report is generated if you select a tree node and press the Generate button on the Parameters panel.
The Parameters panel allows you to select:
- A report type (from the drop-down menu).
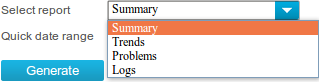

There are four report types: Summary, Problems, Trends, and Logs. The summary monitor report contains a performance graph and state change log; all other reports include “pseudo graphs” (color-coded state change records) and a statistical summary. Refer to Report Types and Generation for more information on report types. - A report period. There are several predefined periods that you can select from the drop-down menu; once you do so, the system will set the report start and end dates automatically.
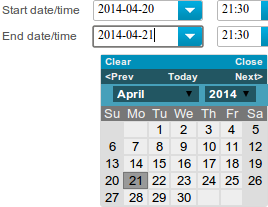
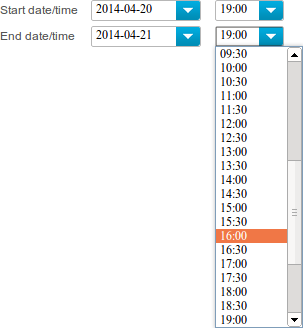
You can also define the report start and end dates manually; the report period will be reset to Custom. Dates are selected using a calendar, and times are chosen from the drop-down menu with 30-minute accuracy.
- The set of monitors included in group reports. You may choose whether the report should include stopped monitors or monitors that have just been discovered but not started yet.


When the report is configured, you can either  (the report will appear in the Report panel) or
  it (the report will appear in a new browser window or tab without the Tree View and Parameters panel, and the standard Printer selection dialog will be shown). You can also
  the report over E-mail (a form will appear where the destination address and the message subject can be changed; by default, the report is sent to the administrator e-mail address).
Following the hyperlinks in Web interface reports will result in reloading the entire interface with the corresponding monitoring object, report type, and report time period already selected. You can share these links with your colleagues who should look at the report in question. You can also open such a link in a new browser window or tab to create a copy of the Web interface that already displays the necessary report. In contrast, navigating Tree View and changing the report parameters does not reload the Web interface; only the Report panel is updated when you press the button.
Alerts
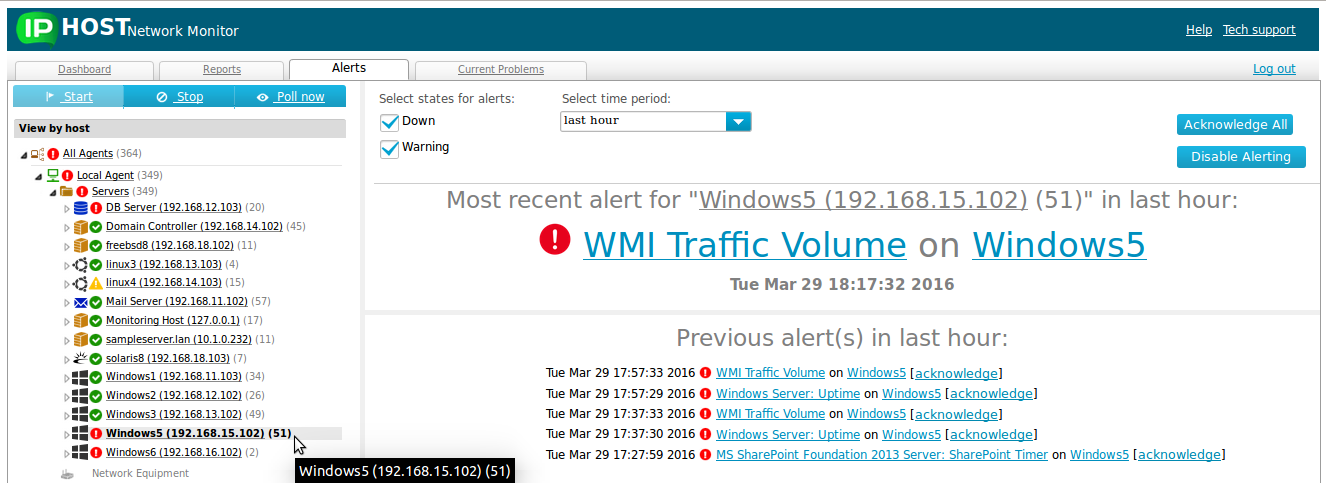
Here you can review availability and performance problem alerts that have recently occurred. The Tree panel displays a monitor tree as on the Report Tab; the Parameters panel allows choosing a subset of “bad” states for which you need to see state change notifications and an alerting time period. The Contents panel is divided in two sections by a movable splitter. The top area displays the last alert; you can resize it to make the alert visible from a long distance. The bottom area lists other alerts that have occurred earlier.
You can acknowledge some of the alerts by pressing a corresponding link near the alert description. It is also possible to acknowledge all alerts you see by pressing the Acknowledge all button on the Parameters panel. Once you acknowledge an alert it disappears from this view and won’t be shown again.
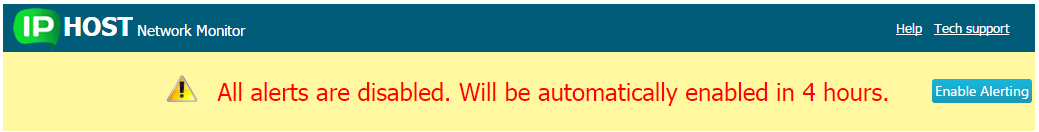
On this page you can enable or disable alerting by clicking the Enable/disable alerting button. If you disable alerting, a dialog opens, in which you should choose whether to enable alerting after a selected time interval automatically or not.
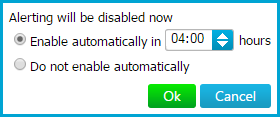
You will see a warning indicator at the top of the Web Interface window while alerting is disabled.
The Web interface also provides a link to the on-line help resource and a link to the IPHost Network Monitor TechSupport page.
Current Problems
This tab displays the list of current availability and performance problems.
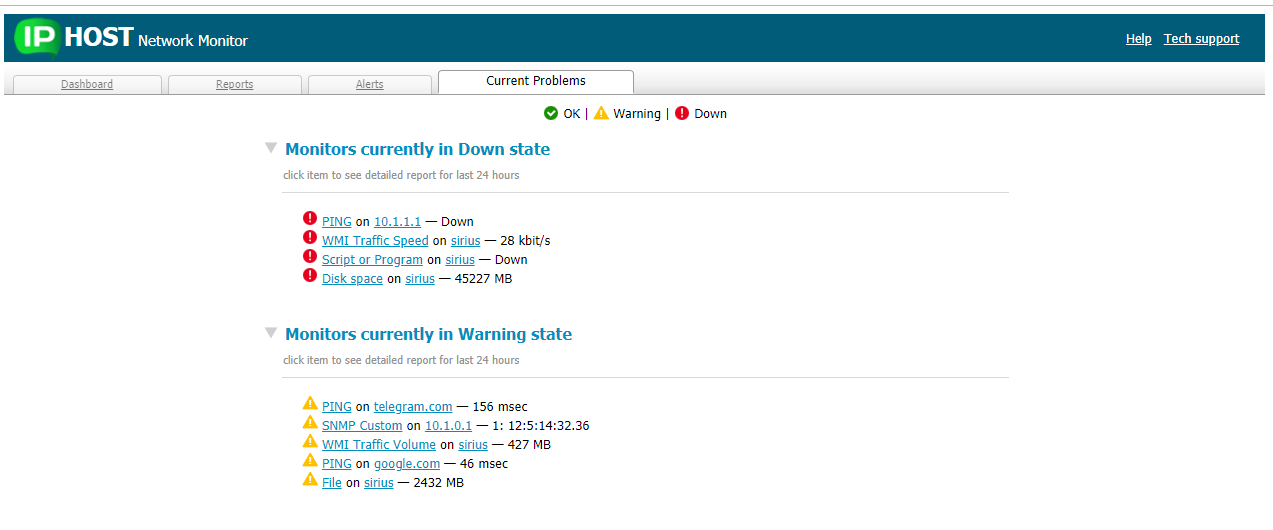
There are two sections Monitors currently in Down state and Monitors currently in Warning state. Each item of the list contains a monitor name and a current performance value if it is available. The links within the monitor name allows you to quickly open pages with the summary report for particular monitor and the summary report for particular host.
Help
This link provides online access to the help pages.
The TechSupport page
This link provides online access to the IPHost Network Monitor TechSupport page.
Web server
The Web interface is provided by Apache web server, version 2.2.26; its configuration file httpd.conf can be found in the conf/ subdirectory of your installation directory and you can change it to suit your needs. The client GUI changes this file to enable or disable the Digest HTTP authentication with the access password when you modify a corresponding setting on the Settings -> Web Interface page.
Accessing the IPHost Web Interface via HTTPS
To enable a secure HTTPS version of the Web Interface use the settings on Settings -> Web Interface page. You can configure the Apache server to work via HTTP, or via HTTP(S), on via both protocols.